COVID-19 data visualizations
Gabriel Mello Silva
2020-04-23
The coronavirus disease 2019 (COVID-19) was first identified in Wuhan (China) in December 2019 and since then is spreading at an alarming rate across the world. On March 2020, the World Health Organization (WHO) declared the COVID-19 outbreak as a pandemic.
In this project, I explore the repository data of COVID-19 confirmed and death cases published by Johns Hopkins University Center. The data is updated on a daily basis since January 2020.
If possible, #StayHome.
Confirmed cases
Currently, there are more than 2 620 000 confirmed cases and more than 183 000 deaths worldwide. But besides total numbers, we should be worried about how fast the disease is spreading around the world. The speed that the virus contaminates the population vary with each country’s internal and border traffic and governamental isolation counter measures, among other factors.
The plot below shows the evolution in time of COVID-19 confirmed cases in all countries around the globe. Many countries have quite similar trends, but some of them start at different points. The United States curve stands out with an alarming growth rate of cases. The jump in China’s curve around mid February is not due to a sudden increase in the number of case but to a change in counting procedure.
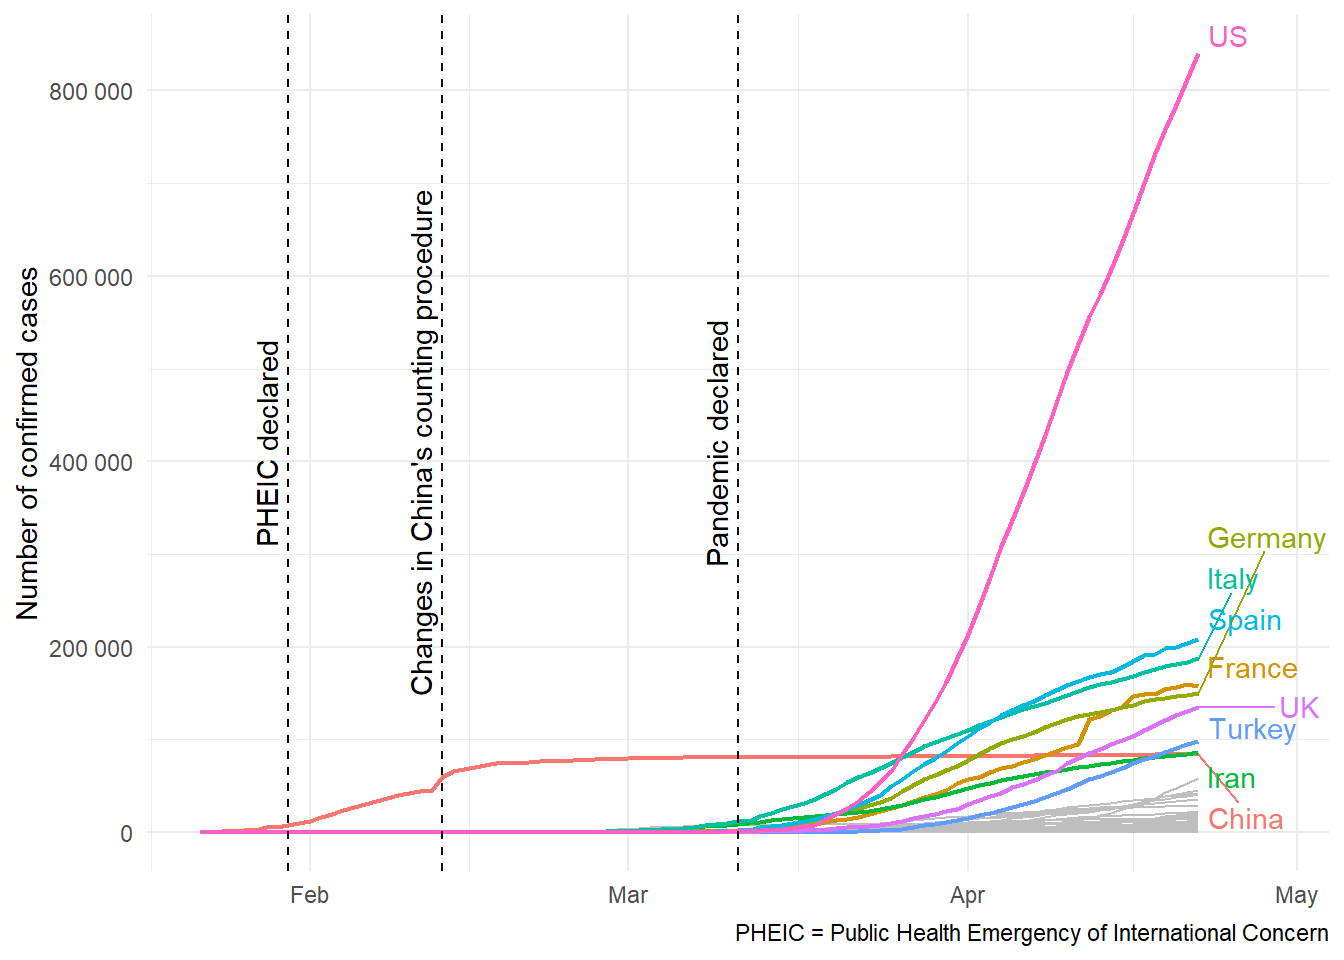
Cummulative confirmed cases of COVID-19 through time. Countries with most cases are highlighted.
The plot below compares how the number of confirmed cases of China compares with the rest of the world. While China seems to have stabilized around the first half of March (before the pandemic was declared), the curve of the other countries (as a whole) is starting to slow down just after April.
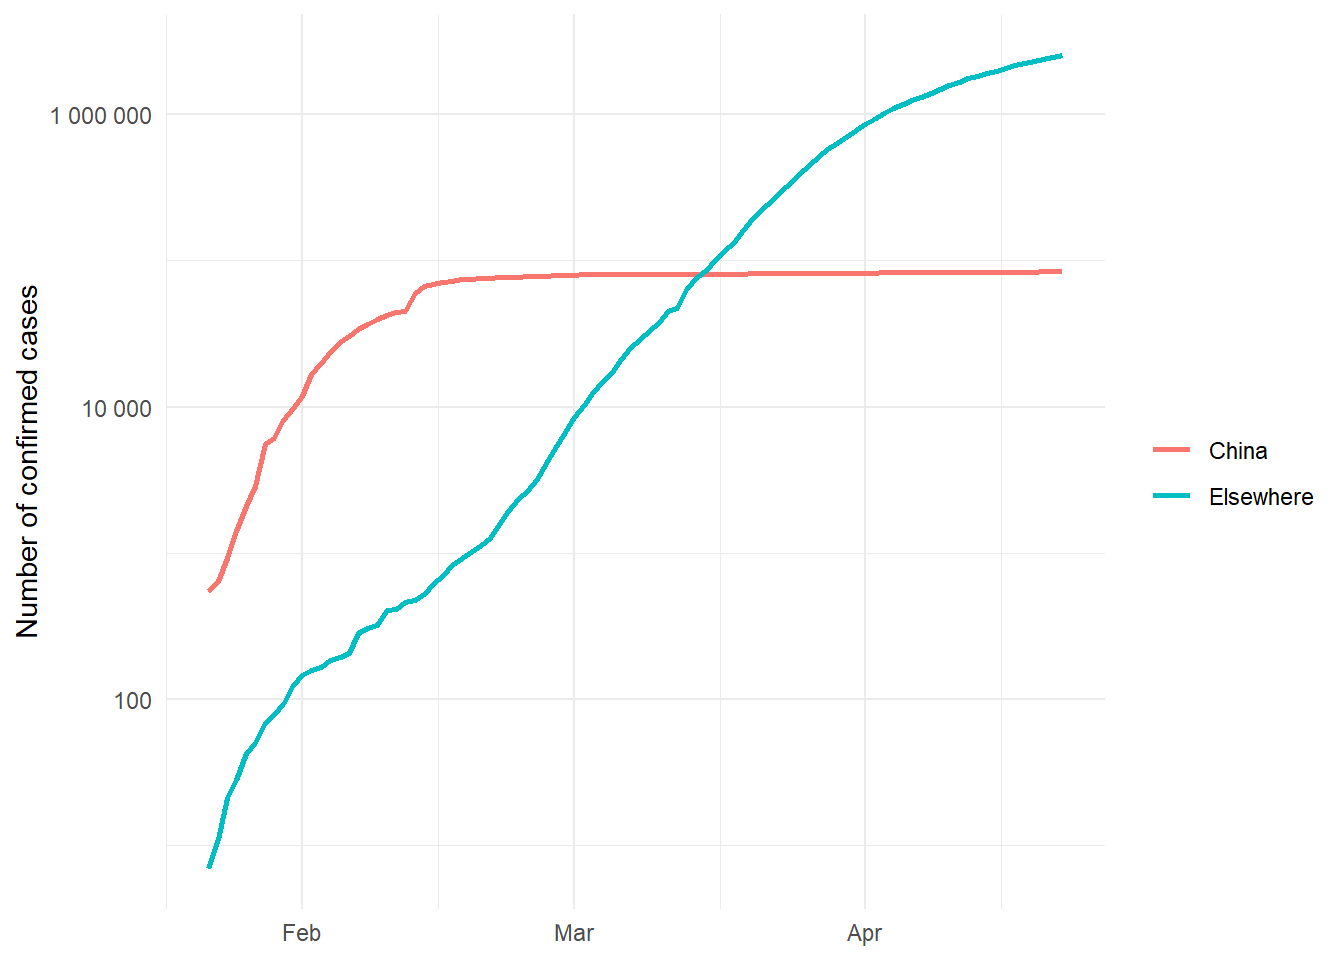
Confirmed cases (log scale) comparasion between China and the rest of world.
Worldwide spreading
It is also interesting to visualize the spreading of COVID-19 around the world both in space and time. For this, the animated map below is quite useful. It alludes to how fast the disease turned into a pandemic – that is, how it turned from a local to a global issue – but trades the ease of reading the number of cases for the visual representation of countries in the map.
 to enlarge.](covid-19_en_files/figure-html/world_map-1.gif)
Animated map of number of confirmed COVID-19 cases through time. Click here to enlarge.
Lethality
Another concern is how deadly the disease is. Currently, the lethality rate (number of deaths divided by number of confirmed cases) is at 7.0% across the world. But this rate vary for each country, because it depends on the population caracteristics, healthcare system conditions and governamental efforts.
The plot below shows, in log-log scale, the deaths versus confirmed cases per country population facetted into six continental areas. It also shows equal lethality percentages lines for reference. We can see that most countries’ lethality percentages lie somewhat between 2.5% and 10.0%. Countries with the lowest and highest percentages, as well as some well know countries, are highlighted in each continent.
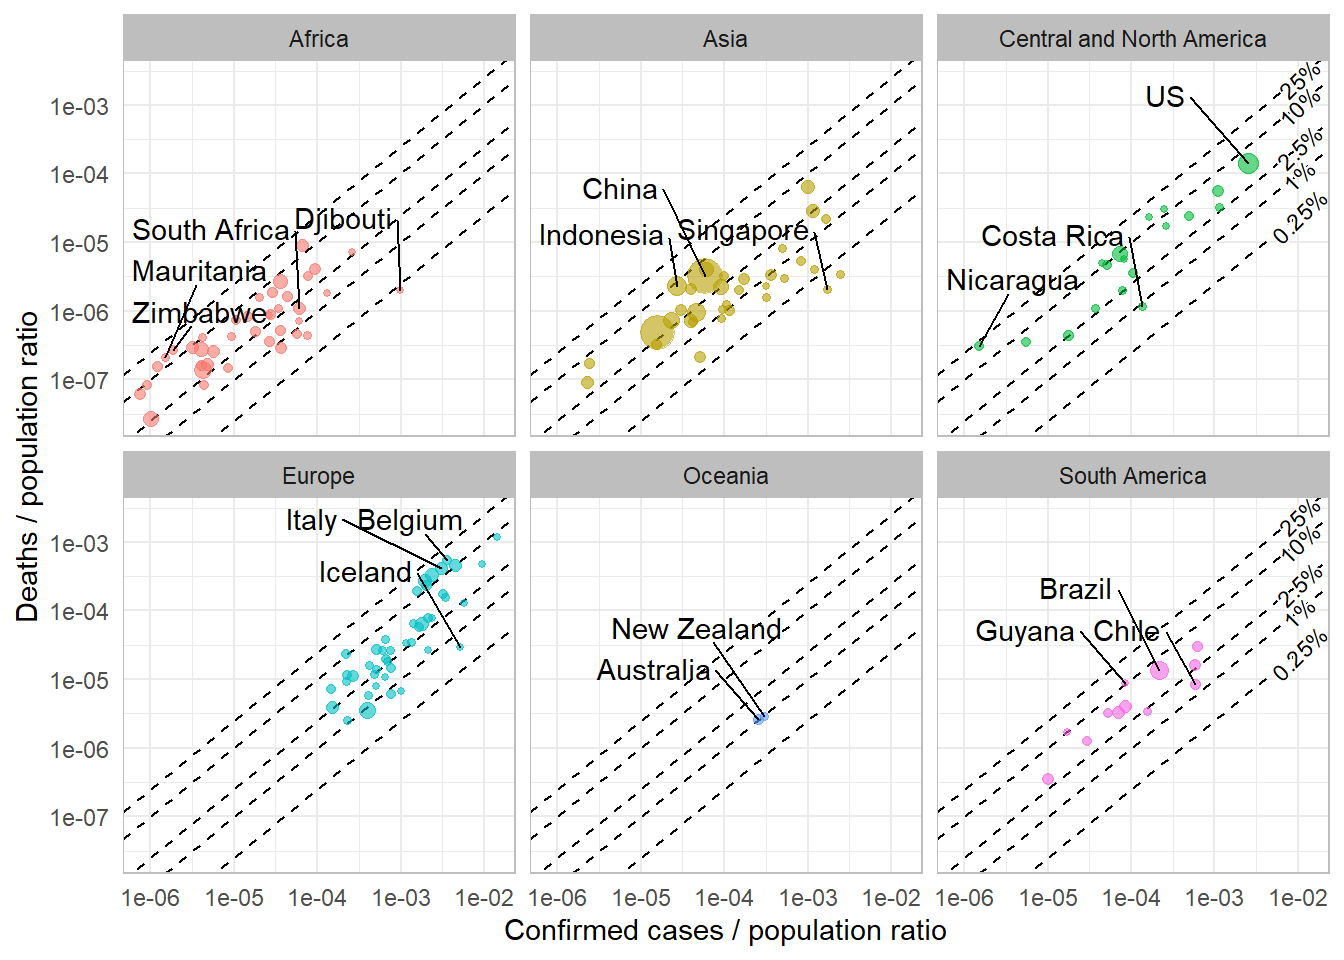
Deaths versus confirmed COVID-19 cases per country population ratios (log-log scale) as of 2020-04-22. Each plot contains equal lethality percentages (deaths / confirmed cases) lines.
Final thoughts
Communication is one of the most fundamental skills for a data scientist. The ability to present insights from data and generate value for readers or associates is always the final goal of any work. For this purpose, graphical tools are a way to concisely to explore data and show results or patterns.
Hopefully, these data visualizations can convey a concern for the COVID-19 spreading. It is a global issue that needs to be cooperatively addressed to counter act its consequences. Everyone can contribute to minimize the risk of infection by staying home whenever possible, using masks and washing hands. These are small actions that can save your and others lives.